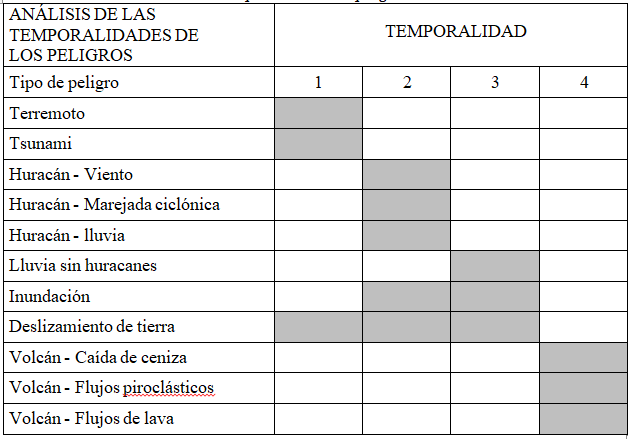
Flood
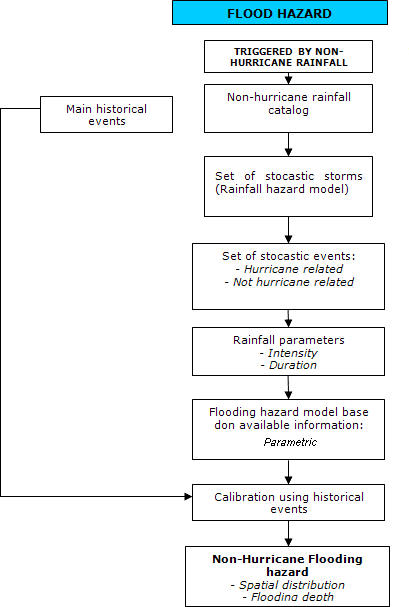
The flood hazard for Guyana is assessed for the coastal clay belt ecological zone because of its administrative, economic and social importance for the country in terms exposed assets, such as crops, infrastructure, population, and location of the capital city and main towns. The risk of flooding due to the overflowing of rivers after excess rain is directly related to rainfall in the analysed basin, and the topographic characteristics of the terrain surrounding the watercourse. Therefore, models used to determine run-off based on rainfall causing it, are based on run-off ratios. The method for estimating the risk of flooding is divided into a hydrological analysis, hydraulic analysis, and a plane flow analysis.
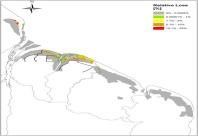
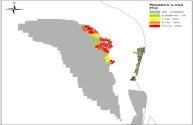
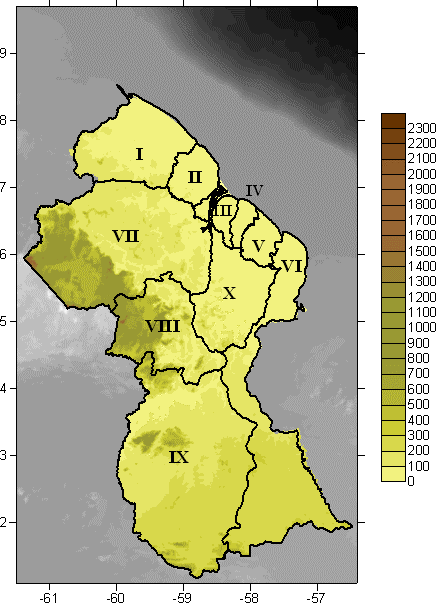
Administrative division of Guyana. Altitude in meters, presents the most important rivers and creeks of the country which are located at the coastal zone.
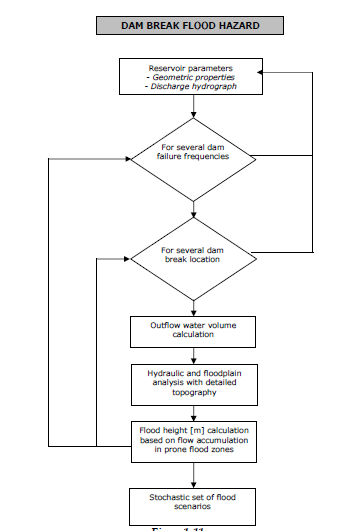
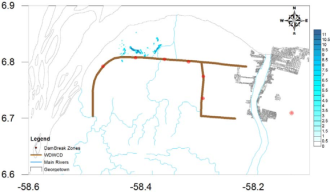
Evaluation model for dam break flood hazard because the erosion of earthen dam failures and the distribution of its intensity in a region of interest is one of the two approaches for assessing the flood hazard in the coastal plain of Guyana. Is needed a convenient coverage of pluviometric stations, depending on the zone of interest conditions, such as: topography, altitude, vegetation, land cover, etc.
Identificación de fuentes sísmicas
Caracterización del potencial de generación de terremotos de cada fuente
Modelación de la distribución de la intensidad sísmica como una función de la magnitud y la distancia
Aplicación de la teoría de la probabilidad
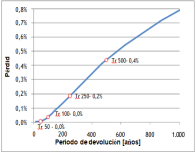
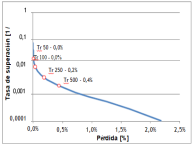
- a. Flood hazard results are presented in terms of intensities (flood depth, m) for selected return periods and durations of storm.
- b. The principal result of a flood hazard model is the demarcation of areas subject to flooding for a defined return period or rate of exceedance.
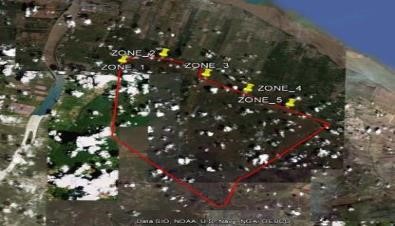
- c. For each of the five dam break zones four flood scenarios are assessed, which correspond to every given dam break period of interest (1, 5, 24 and 48 hours).
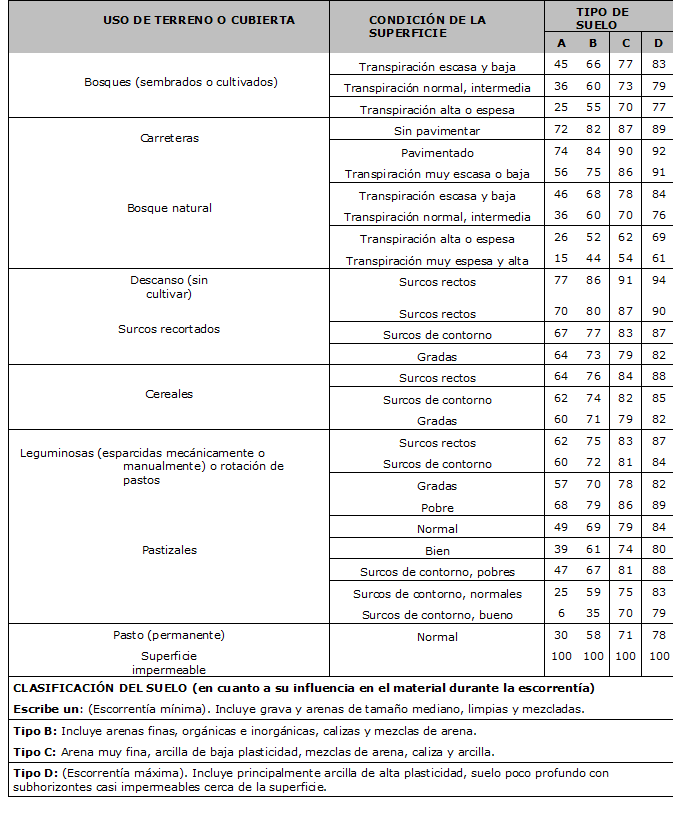
- a. The percentage of total rainfall which becomes effective depends mainly on the characteristics of saturation and permeability of surface soils, vegetation cover, and use.
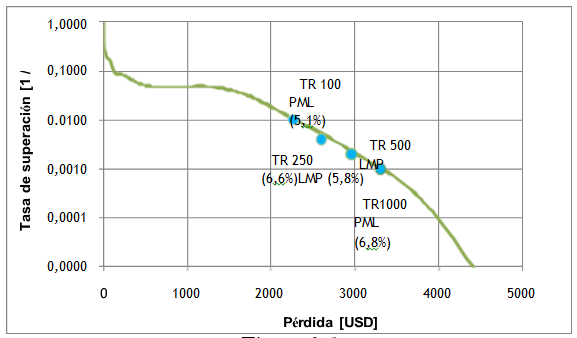
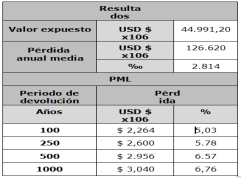
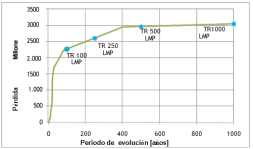
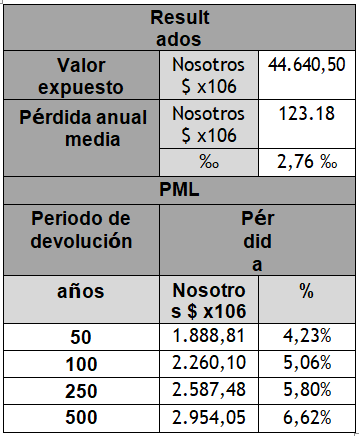
- b. The flood hazard is included, in order to obtain the exceedance rates for different intensity values and maps for the same return period (50, 100, 500 and 1000 years).
- c. The document presents the construction of models to create a set of stochastic flood scenarios, each of which has an annual frequency of occurrence equal to that of the heavy rain scenario that triggered the flood event.
The country lies on the tropical zone of South America and because of its location the seasonal rainfall, high humidity and tide variances of the Atlantic Ocean directly affects the population and the exposed assets of the country. The rainfall regime in Guyana is bimodal with periods between May and August, and November to January. Guyana is divided into four main ecological zones: interior plains and savannahs, the coastal clay belt, sand belt and the highlands. The river along Georgetown (Demerara) and the Essequibo River constitute a natural barrier for flooding events along the coastal zone because of the hydraulic capacity of their river bed.
The procedure for probabilistic calculation is included, an evaluation of losses that will affect a group of exposed assets during each of the scenarios which collectively describe the hazard, and then probabilistically integrating the results obtained using the frequency of occurrence of each scenario as a weighting factor.
Some natural phenomena produce losses of different kinds, and they occur simultaneously and cannot be considered as independent events.
The intensity of rain must be translated into an effective depth of rainfall, which corresponds to the portion of total rainfall which may run off and reach natural watercourses or floodable areas.
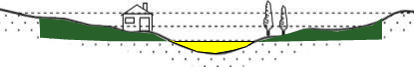
The depth of the flood is calculated based on effective rainfall and flooding factors, which mainly depend on the topographical conditions of the area under study.
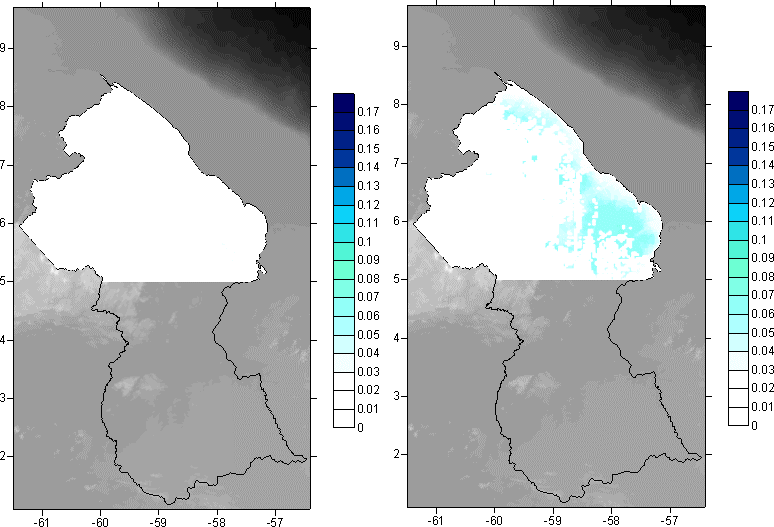
A stochastic convective rain generation model is presented for the coastal zone of Guyana. The purpose of the model is to establish relations between the maximum depths of average rainfall (P), the area (A), in which this depth falls, duration (D.)
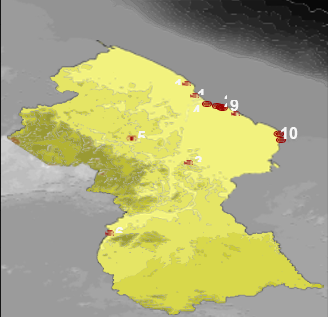
For the PADF Curves analysis where chosen eleven pluviometric stations excluding Lethem because of its location and its rainfall generation process.
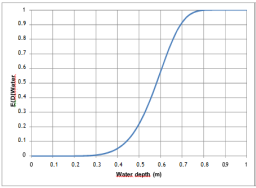
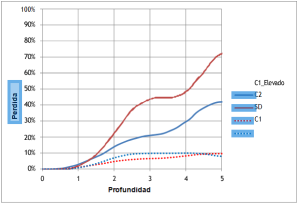
Vulnerability means the quantification of loss and damage caused to each asset class by the intensity (any relevant parameter) of a given event at a site (Miranda, 1999). The development of asset classification is based on a combination of construction material, construction type, building use, number of stories, age, etc. Estimation of damage is measured in terms of the mean damage ratio (MDR). The MDR is defined as the ratio of the expected repair cost to the replacement cost of the structure. A vulnerability function is defined relating the MDR to the flooding intensity which can be expressed in terms of water depth.
- a. Vulnerability functions provide all the necessary information to calculate the probability of reaching or exceeding a loss value, given a water depth value.
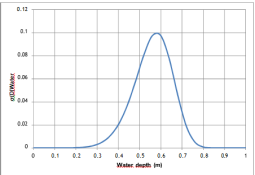
- b. The vulnerability function can be estimated, using a general methodology of fragility curves according to the state of damage.
- c. Specific building typology, a generalized analytical model of its capacity, vulnerability function and standard deviation for each damage value.
- d. Vulnerability functions establish probabilistic relations between water depth, and damage suffered by the building under study. Damage is interpreted as the reconstruction cost after the flooding as a fraction of total value.
- a. The evaluation of the expected physical damage, which quantifies the average loss to a particular structure or infrastructure starting from the flooding hazard scenario and the structural vulnerability.
- b. Vulnerability functions establish probabilistic relations between water depth, and damage suffered by the building under study.
- c. Vulnerability functions provide all the necessary information to calculate the probability of reaching or exceeding a loss value, given a water depth value. Loss is defined using numerical scales instead of qualitative scales as for damage states, which allows its direct use in probabilistic risk and loss calculations
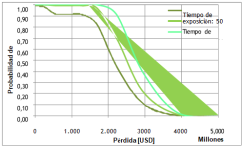
The study contemplates a probabilistic risk analysis with the fundamental objective of determining the distribution of probability of loss that the exposed assets may suffer in a given period of time, as a consequence of the occurrence of natural hazards, rationally integrating the uncertainties that exist in different parts of process. The basic question that this probabilistic analysis tries to answer is, given that there is a set of assets exposed to the effects of one or more natural hazards, how often will losses occur above a certain value? Analysis of rainfall and its intensity distribution in a region is the first step in subsequent flood hazard assessments. Risk assessment requires three analytical steps:
Risk assessment, definition of the inventory of exposed elements and vulnerability of buildings.


- a. The probabilistic analysis of risk involves uncertainties which cannot be ignored, and which should be propagated throughout the process of calculation. This section describes the general basis of calculation that can be used to achieve the objective proposed.


- a. For each of the risks considered, a set of events is defined along with their respective frequencies of occurrence, which are an integral representation of the related hazard.v
- b. An inventory of the exposed elements must be made specify their geographical location, Physical valuable, human value, Structural class.
- c. The vulnerability function must be assigned to the structures, for each type of threat. Characterizing the behavior of the asset during the occurrence of hazard phenomena.
- d. For dam failure flooding, only the City of Georgetown and the City of Anna Regina are affected.