
Flood
Flooding due to rainfall is common in Barbados and can occur throughout many parts of the island. Rainfall estimates for Barbados relied on data from Lirios (1971) with recent updates by the Caribbean Institute for Meteorology and Hydrology (Baird, 2017). The CIMH data provided revised intensity-duration-frequency (IDF) curves for Barbados, which were modified to represent different rainfall intensities over Barbados. Modeling used a combination of the SWAT model (which considered soil type, and infiltration and built upon previous modeling efforts in Barbados)


Flooding due to rainfall was assessed and reported in the hazard assessment phase of the NCRIPP study (Baird, 2017a). Simulations were undertaken with a combination of one-dimensional and two-dimensional models (SWAT and MIKE21FM). Exposure mapping provided detailed information on the extent and depth of flooding throughout Barbados for a range of return periods. Flood exposure is much more spatially specific than some hazards, meaning that it is reasonable to calculate risk based on individual assets, rather than for a general region.
Identificación de fuentes sísmicas
Caracterización del potencial de generación de terremotos de cada fuente
Modelación de la distribución de la intensidad sísmica como una función de la magnitud y la distancia
Aplicación de la teoría de la probabilidad
- Flooding due to rainfall was assessed and reported in the hazard assessment phase of the NCRIPP study (Baird, 2017a).
- SWAT was used to assess the delivery of water down the gullies to the nearshore regions, while MIKE21FM was used for broader inland areas as well as the more detailed flooding near the coast.
- Flood simulations for the NCRIPP were limited in their overall scope by both schedule and budget. A detailed assessment of flooding would have required more field data collected over many seasons, which was not possible during this study

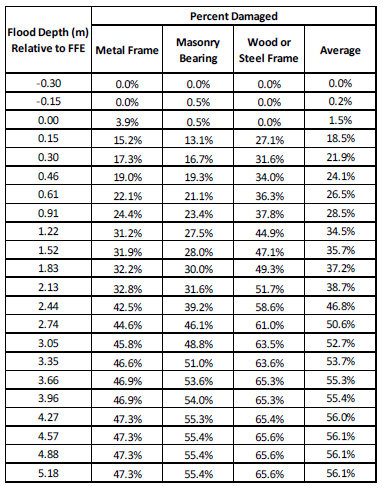
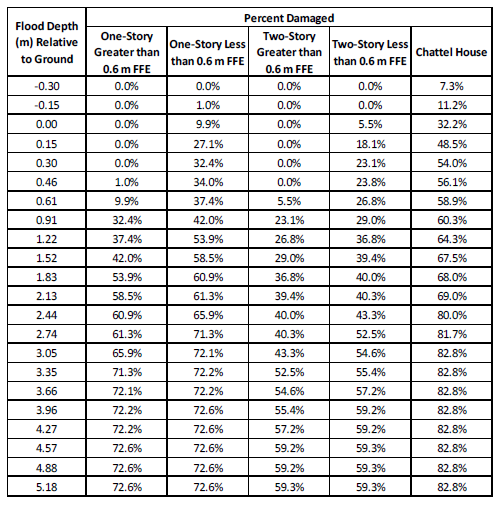
Building-specific flood damage was estimated as the percentage of structure loss versus water depth. These data were derived from U.S. estimates and applied for different types of structures. Assets are grouped into residential and non-residential categories, and are also presented separately for the building stock. Losses for building contents and vehicles are also considered, in addition to loss of life. The process to compute commercial damages is the same as residential damages, except a different depth damage function is applied.
- Floods are assumed to be short in duration (less than a day) for all areas except those inland areas where floodwater recedes through gradual infiltration (e.g. St. Georges Valley).
- The Mobile Home depth-damage function is used to assess damages for Chattel Houses.
- The depth-damage function is shifted 0.6 m (2 ft) for houses with foundations greater than 0.6 m off the ground.
- No structures are defined as “pier foundation”.
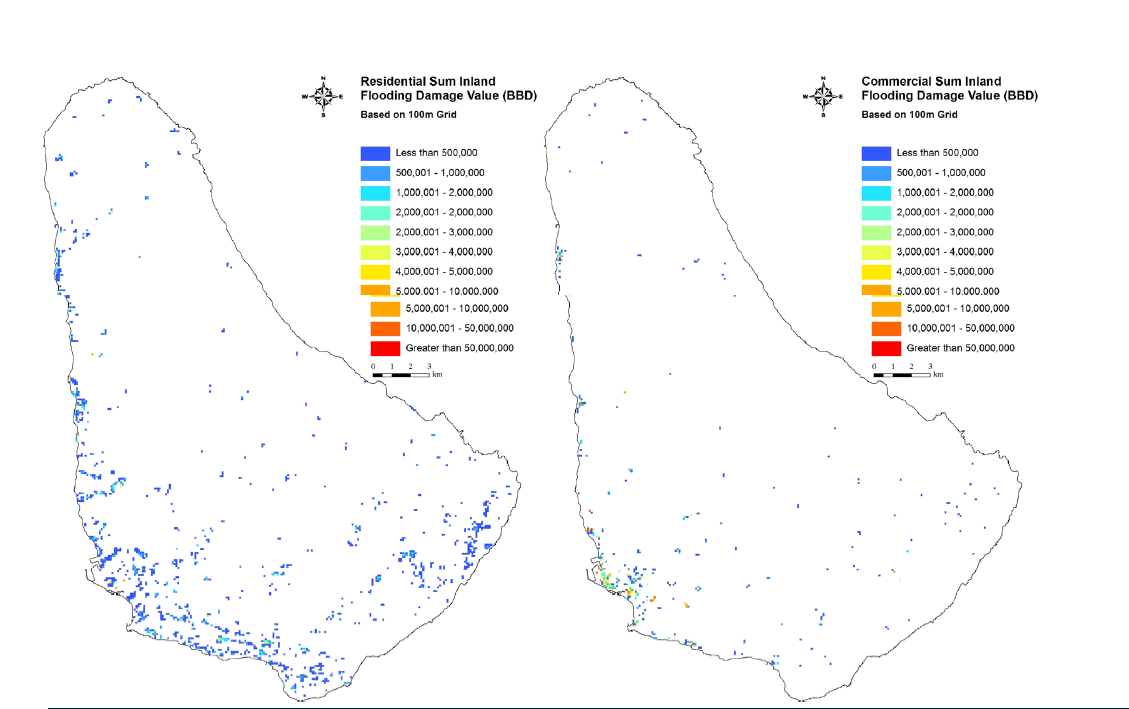
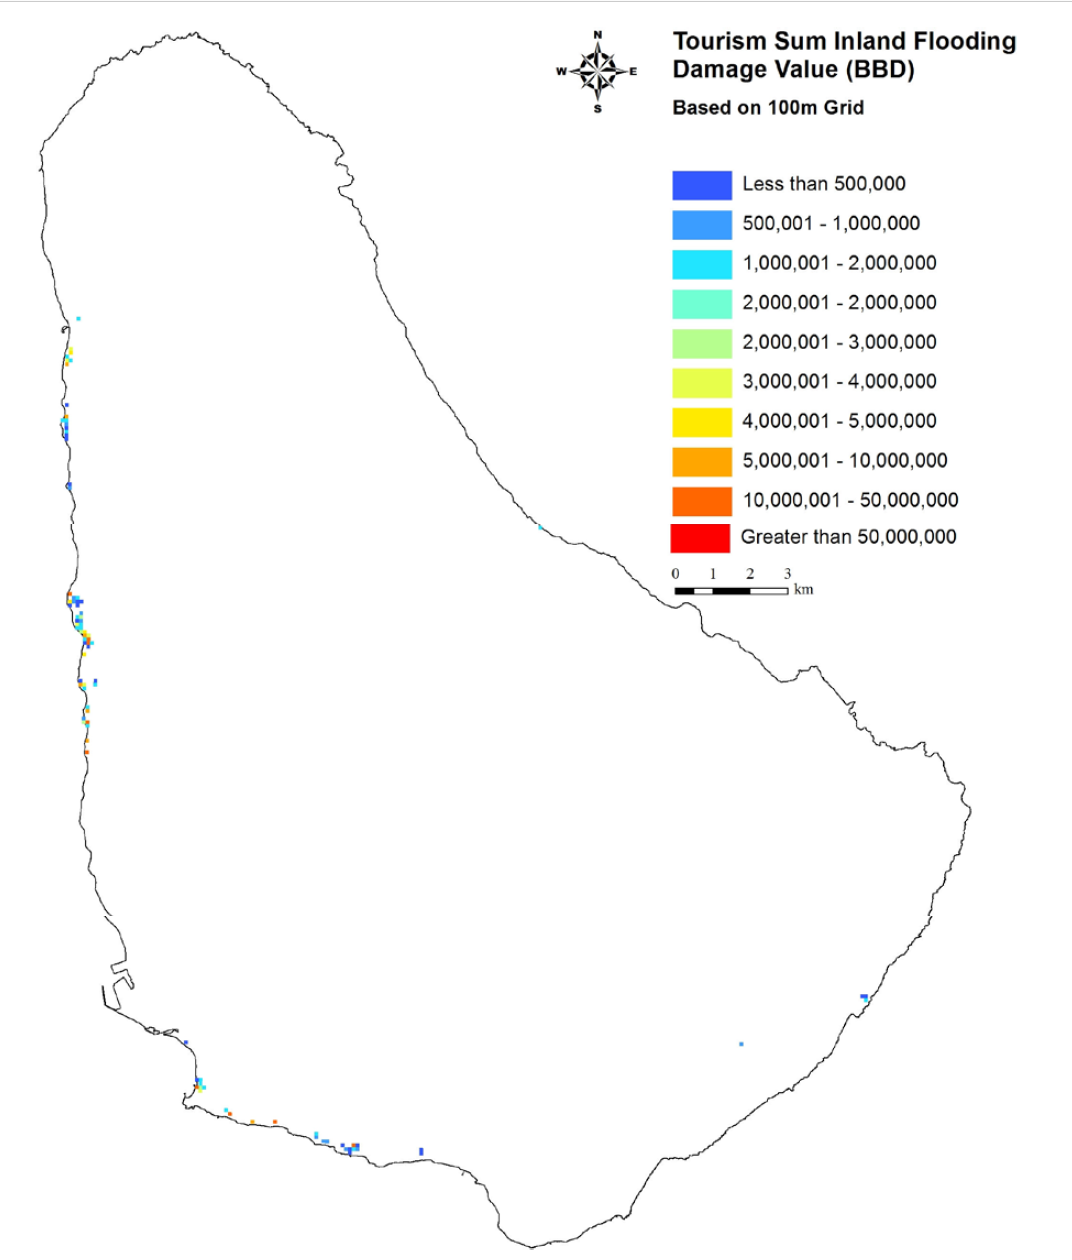
The vulnerability assessment phase included cataloguing assets throughout Barbados to examine the exposure of these assets to the spatial extent of the hazards, as well as defining the parameters that would make these assets more or less susceptible, such as building types and social vulnerability. Flooding due to storm surge has a large influence on residential, commercial and tourism assets, with totals damages in the range of BBD 3 billion for the 100 year condition. The risk of flooding due to rainfall for the 100 year event is estimated to be approximately BBD 900 million.
- Flood simulations for the NCRIPP were limited in their overall scope by both schedule and budget
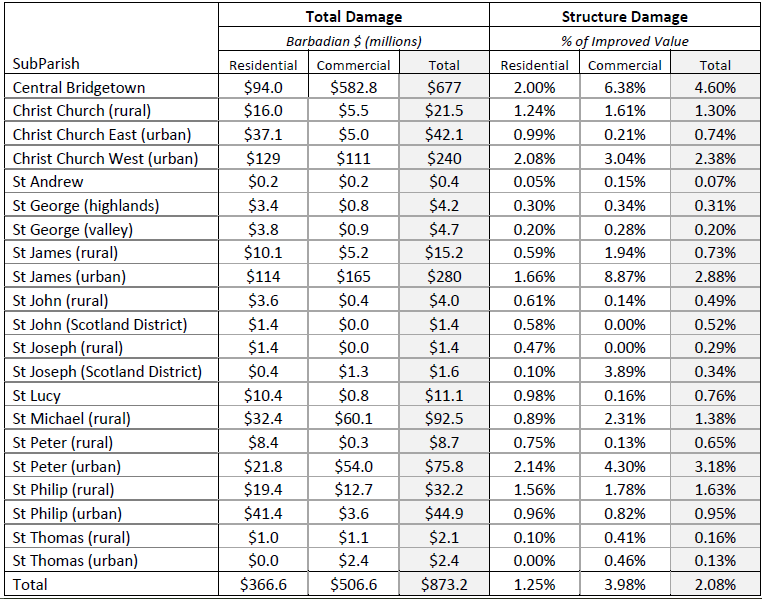
- Some of the largest damages are in the Bridgetown area, although with limited information on the urban drainage in this region, we believe the risk in this area is likely overestimated.
- Flood exposure is much more spatially specific than some hazards, meaning that it is reasonable to calculate risk based on individual assets, rather than for a general region.
Exposure mapping provided detailed information on the extent and depth of flooding throughout Barbados for a range of return periods. The data from the BRA includes the “Improved Value”, which represents the value of the structure (not the land). Improved value for parcels with multiple structures is allocated based on structure area. summary of the asset data.
- Structure use (residential/commercial
- Foundation type (concrete slab, finished floor elevation greater than 0.6 m): From Baird Housing Stock Survey, and subsequent interpolation to unsurveyed districts.
- Structure type (Chattel house/one story/two or more stories): From CRMP LiDAR data set (provides floor area and height of structure)
- Structure value: From BRA data set based on the “Improved Value”
- Structure location: From LiDAR Building Footprints
- Much of the work that has been completed regarding damage functions results from work undertaken in the regions of the USA that front the Gulf of Mexico, as well as in some flood prone parts of Europe


- The data from the BRA includes the “Improved Value”, which represents the value of the structure (not the land).
- Every structure is assigned a flood depth for each return period storm and a specific depth damage function based on the structure type

