Earthquake
The probabilistic risk analysis is done based on a series of hazard scenarios that adequately represent the effects of any event of feasible magnitude that can occur on the area of influence. Each of these scenarios has an associated specific frequency or probability of occurrence. The probabilistic calculation procedure comprises the assessment using appropriate metrics, in this case the economic loss, for each exposed asset considering each of the hazard scenarios with their frequency of occurrence, and the probabilistic integration of the obtained results. Seismic risk was calculated using the platform CAPRA-GIS (ERN 2009).
The seismic hazard for Belize is calculated for all the seismic sources capable of generating earthquakes with possible adverse effects on the inhabitants and infrastructure. The seismic hazard assessment can be found on the report ERN-CAPRA-T1.3 (Probabilistic modeling of natural hazards, ERN 2010) An AME file type (.ame from amenaza in Spanish) is produced in this module for each type of hazard, which includes multiple grids, on the area of study, of the different parameters of intensity of the considered phenomena. Each grid is a scenario of the intensity level obtained from historical or stochastic generated events, with their frequency of occurrence. For this case the parameter of seismic intensity selected is the spectral acceleration.
Identificación de fuentes sísmicas
AD – Adobe
MD1 – Wood frame
MD2 – Wood frame
MS1 – Unreinforced Masonry
MS2 – Unreinforced Masonry
MR1 –Reinforced Masonry
MR2 – Reinforced Masonry
PCR – Reinforced concrete frame
Caracterización del potencial de generación de terremotos de cada fuente
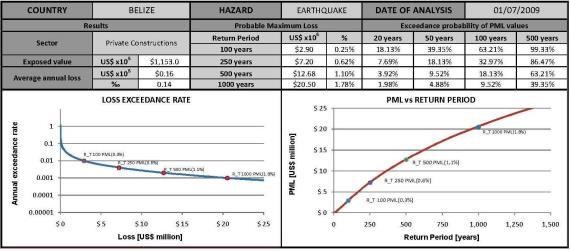
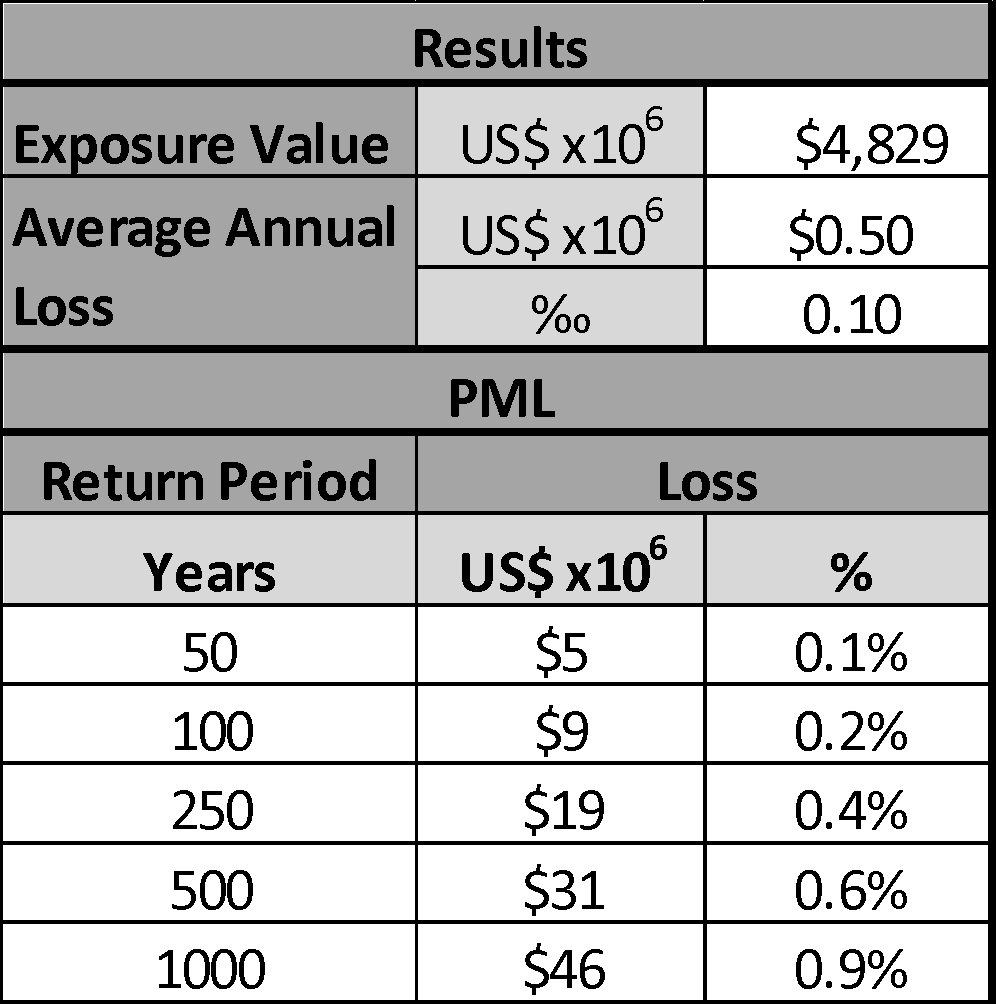
For each district, a complementary individual analysis is carried out. This allows estimating the probable maximum loss level and the individual premium level by district. In each case, results are presented as follows:
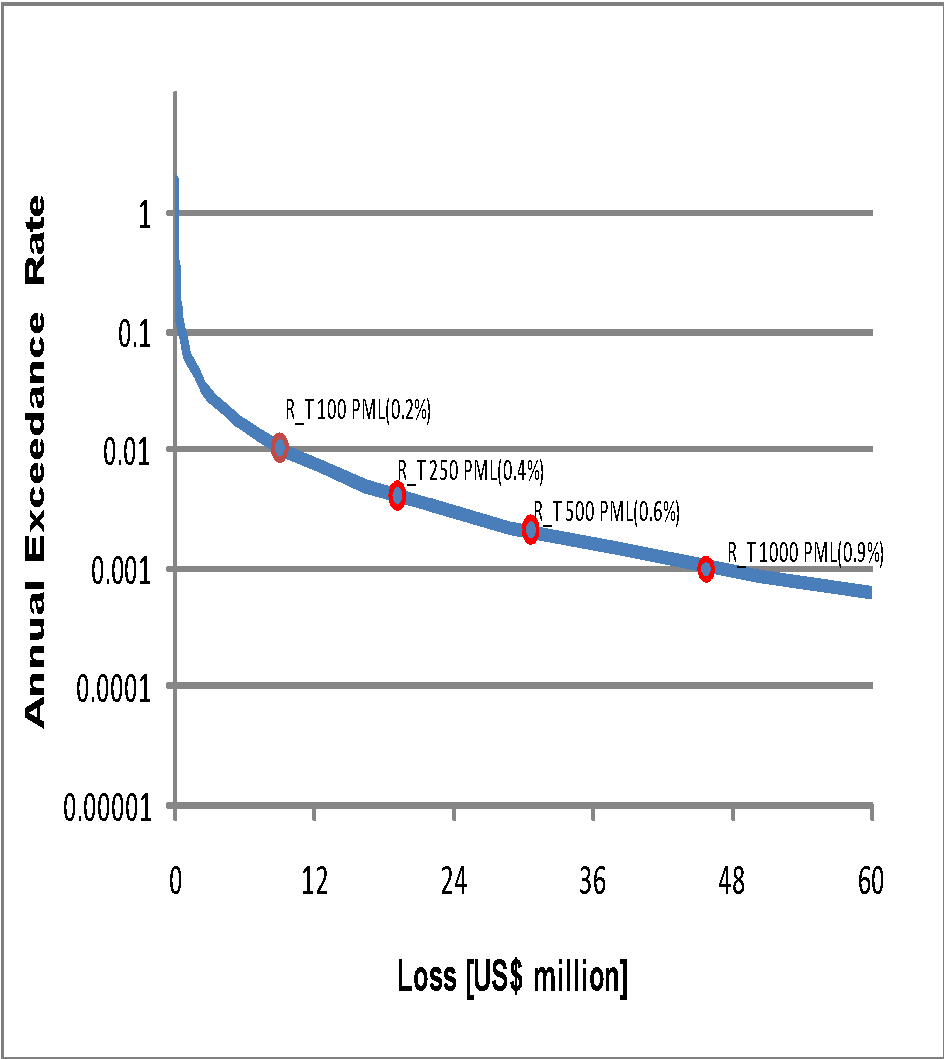
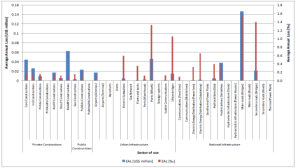
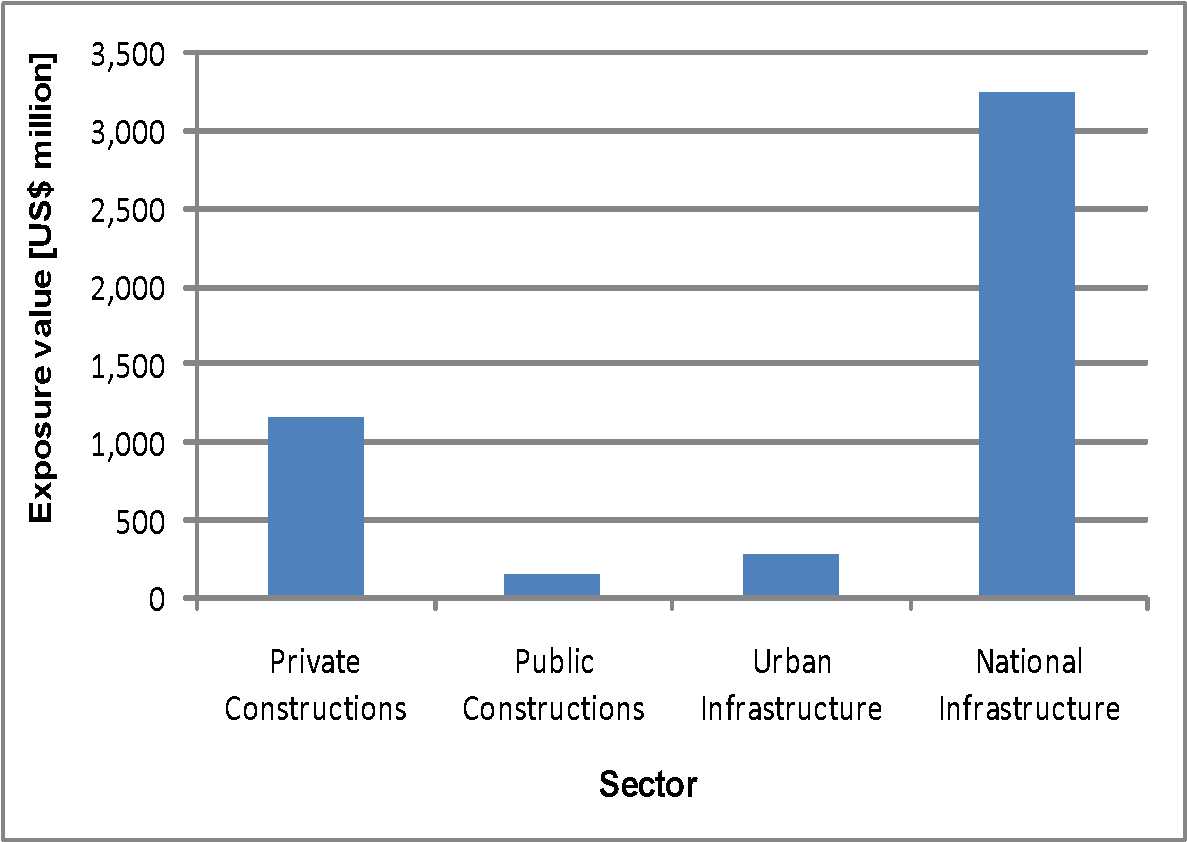
A table summarizing the average annual loss (AAL) and the probable maximum loss (PML) Loss exceedance rate curves and PML with the corresponding return periods Bar diagram with AAL figures in exposed value and thousand of exposed value, for each sector of use.
Modelación de la distribución de la intensidad sísmica como una función de la magnitud y la distancia
For each type of natural phenomena, using the module, it is possible to calculate the probable maximum value of the intensity that is characterized for different exceedance rates or return periods. In other cases, such as buried piping systems, it is more convenient to use the maximum ground velocity as an intensity parameter.
Aplicación de la teoría de la probabilidad
The probabilistic calculation procedure comprises the assessment using appropriate metrics, in this case the economic loss, for each exposed asset considering each of the hazard scenarios with their frequency of occurrence, and the probabilistic integration of the obtained results.
- a. Presents the consolidated information for the all country in terms of total exposed value, the expected annual loss in value and in thousands (also known as technical risk premium) and indicative values of probable maximum loss for different return periods
- a. For each district, a complementary individual analysis is carried out. This allows estimating the probable maximum loss level and the individual premium level by district
- a. For each district, a complementary individual analysis is carried out. This allows estimating the probable maximum loss level and the individual premium level by district.
- b. Analysis presents the AAL results including the total results for the three main sectors of use: urban constructions, urban infrastructure and national infrastructure.
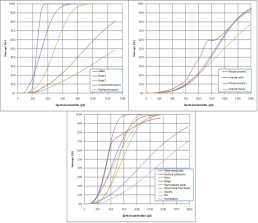
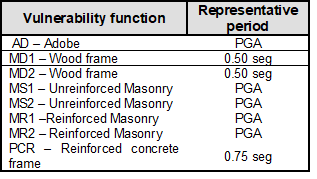
Seismic vulnerability is the ratio between any measure of intensity of the phenomenon and the level of damage of the physical exposed element to such seismic intensity. For example, for the case of several floor building constructions, the seismic intensity that best correlates to the expected damages is the drift or angular distortion between floors. For other types of constructions, such as smaller buildings made of masonry or adobe, the maximum ground acceleration is used as correlation parameter regarding damage. In other cases, such as buried piping systems, it is more convenient to use the maximum ground velocity as an intensity parameter.
Table 3-2 presents the consolidated information for the all country in terms of total exposed value, the expected annual loss in value and in thousands (also known as technical risk premium) and indicative values of probable maximum loss for different return periods.
The probabilistic risk analysis is done based on a series of hazard scenarios that adequately represent the effects of any event of feasible magnitude that can occur on the area of influence.
To assess the probable maximum loss for public and private sectors it is necessary to conduct analyses for each portfolio, because these types of results depend on the relative geographic distribution of the exposure values.
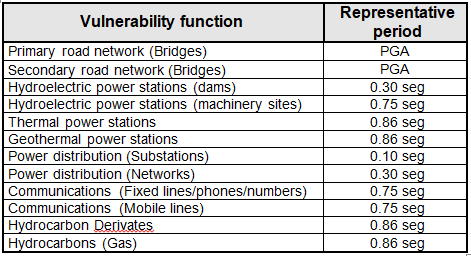
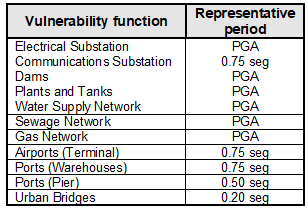
For the national infrastructure analysis to the previous one is carried out for the national infrastructure sector taking into account that individual analyses can be performed for: Power generation and distribution, Communications, Transportation (roads and bridges), Hydrocarbons

Vulnerability Module: This module allows the generation of vulnerability functions based on the direct use or modification of existing functions chosen from a library of functions, or by generating new functions from specific information of construction class of the exposed asset or element that has to resist or cope with the phenomena. The assignment of the vulnerability function to each element is carried out on the shape format file processed in the exposure module. For the national infrastructure, a similar analysis to the previous one is carried out for the national infrastructure sector taking into account that individual analyses can be performed.
- a. Seismic vulnerability is the ratio between any measure of intensity of the phenomenon (acceleration, velocity, displacement or any other, whichever shows the best correlation) and the level of damage of the physical exposed element to such seismic intensity.
- b. For other types of constructions, such as smaller buildings made of masonry or adobe, the maximum ground acceleration is used as correlation parameter regarding damage.
- a. Typical multi-story constructions include constructions of several structural systems such as impulse-resistant frames, combined or dual systems, construction systems with structural walls, precast systems and others and, in general, constructions that share the characteristic that the major damage depends mainly of the relative displacement of history.
- a. Presents the consolidated information for the all country in terms of total exposed value, the expected annual loss in value and in thousands (also known as technical risk premium) and indicative values of probable maximum loss for different return periods
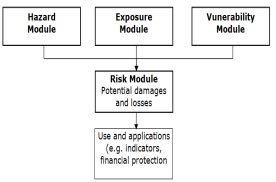
The risk assessment must be prospective, scientifically anticipating possible events that may occur in the future. For the case of seismic events, seismological and engineering bases are used to develop earthquake forecasting models that allow estimating damages, losses and effects as a result of catastrophic events. For the case of hurricanes, the hydro-meteorological information available of the historical hurricanes that have affected the area of study is used together with engineering methodologies; the effects of these phenomena upon the exposed assets are estimated. Due to the high uncertainties inherent to the models of analysis regarding the severity and frequency of occurrence of the events, the risk model is based on probabilistic formulations incorporating those uncertainties in the risk assessment. The document illustrated probabilistic risk model (PRM) constructed as a sequence of modules quantifies the potential losses that arise from a given event.
- a. The frequency of catastrophic events is mainly low by definition, which is the reason why the historical information is generally very limited.
- b. The risk assessment must be prospective, scientifically anticipating possible events that may occur in the future.


- a. Presents the probable maximum loss curve, as exposed value and percentage of exposed value for different return periods. Also, the exceedance probability curves for different PML percentage values for different exposure periods, specifically 20, 50, 100 and 200 years,

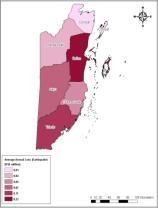
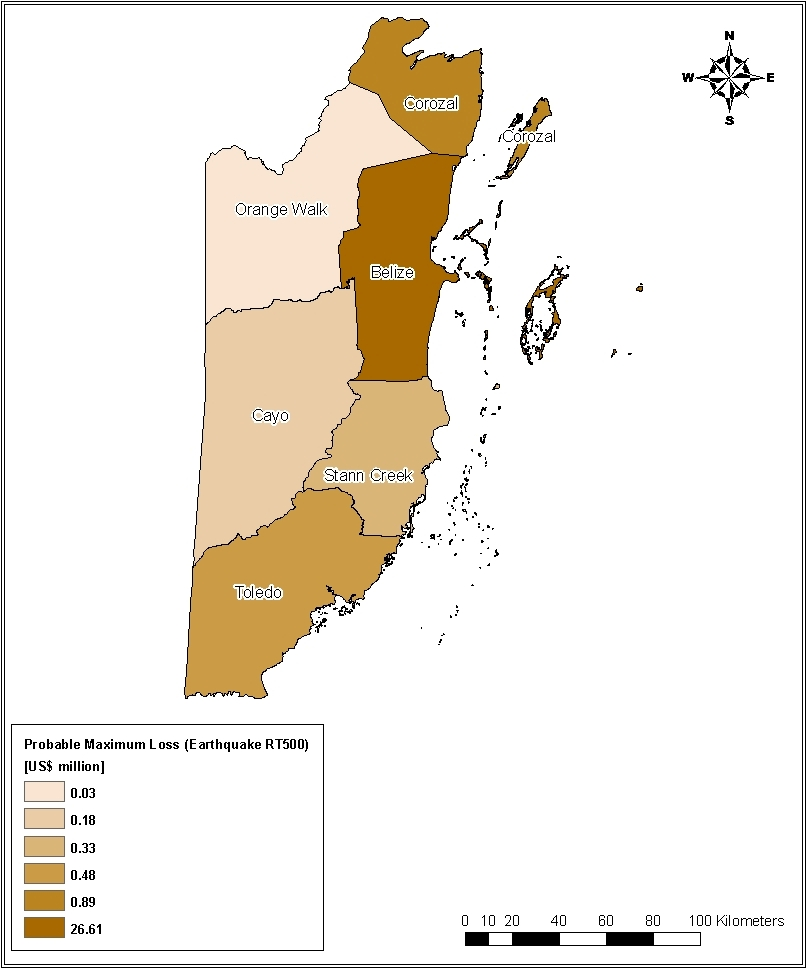
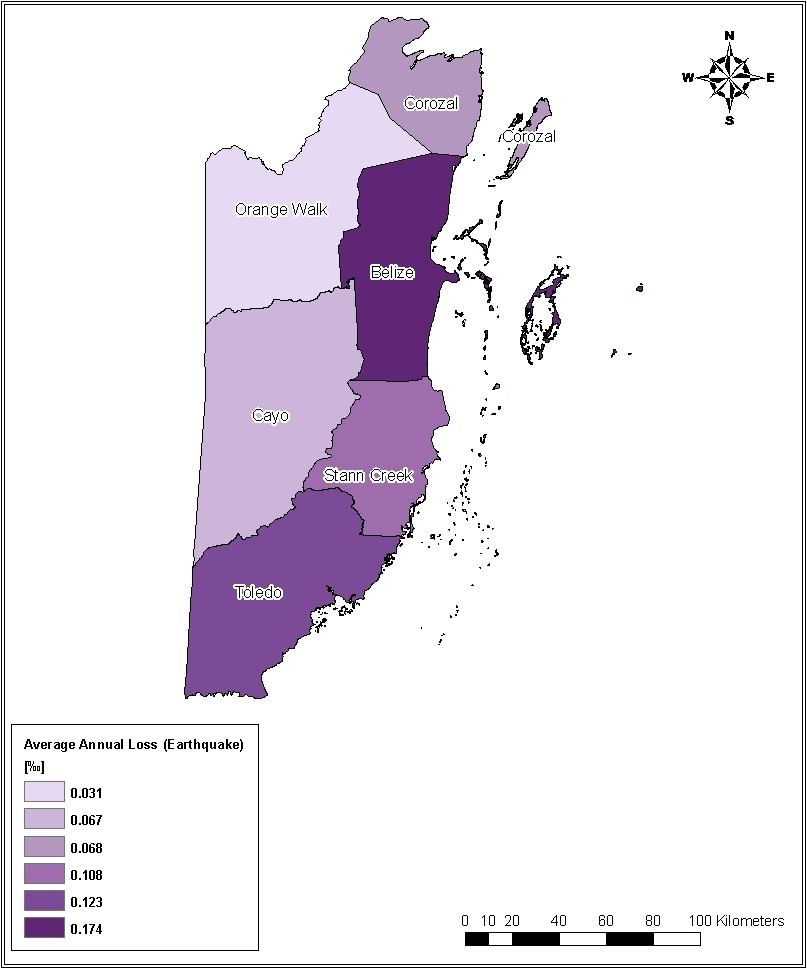
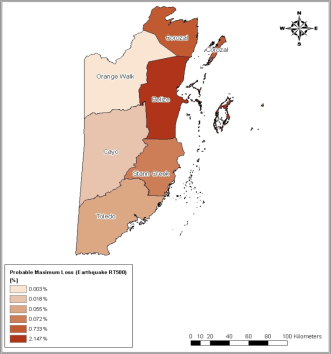
- a. Present maps of the geographic distribution of the average annual losses for each district and values of the probable maximum loss for each district.
- b. Geographic distribution of AAL (value) for earthquake per district