Hurricane
This report presents the catastrophe risk assessment for Belize taking into account that hurricanes are the second natural events that represent the main natural hazards for the country. The analysis of risk concentration is carried out at district level, for the different sectors of use for the public and private sectors and as well for the main components of infrastructure at national level.
The hurricane threat (wind) for Belize is evaluated from the statistical disturbance of the historical trajectories of the hurricanes. The hazard assessment can be found in the report ERN-CAPRA-T1.2 In the case of hurricane force winds, it is suggested that vulnerability is the relationship between the maximum wind speed at the location of the exposed element analyzed and the level of physical damage that can be expected with that maximum wind speed.
Identificación de fuentes sísmicas
Caracterización del potencial de generación de terremotos de cada fuente
Modelación de la distribución de la intensidad sísmica como una función de la magnitud y la distancia
Aplicación de la teoría de la probabilidad
- a. For the case of hurricanes, the hydro-meteorological information available of the historical hurricanes that have affected the area of study is used together with engineering methodologies.
- b. Hurricane hazard (wind) for Belize is assessed from the statistical perturbation of historical hurricane trajectories.
- a. The document shows analyzes that have the following specific functions: Vulnerability, Risk, Hazard and Exposure Module.
- b. Each module requires information about Location of Exposure value of Vulnerability function associated with each type of threat.
- a. For each district, a complementary individual analysis is conducted, that allows estimating the probable maximum loss and the individual premium level by district.

The risk assessment must be prospective, scientifically anticipating possible events that may occur in the future. For the case of hurricanes, the hydro-meteorological information available of the historical hurricanes that have affected the area of study is used together with engineering methodologies; the effects of these phenomena upon the exposed assets are estimated. Due to the high uncertainties inherent to the models of analysis regarding the severity and frequency of occurrence of the events, the risk model is based on probabilistic formulations incorporating those uncertainties in the risk assessment.
To assess the probable maximum losses for public and private sectors, it is necessary to conduct analyses for each portfolio due to the results of this type of analysis depending on the relative geographical distribution of the exposed values.
The public sector includes public urban constructions (health, education –when they are State’s property- and government buildings) and the entire infrastructure. The private sector, on the other hand, includes residential, commercial, industrial constructions and the ones corresponding to the education and health sectors. For each district, a complementary individual analysis is carried out, which makes it possible to estimate the probable maximum loss and the individual premium level per district.
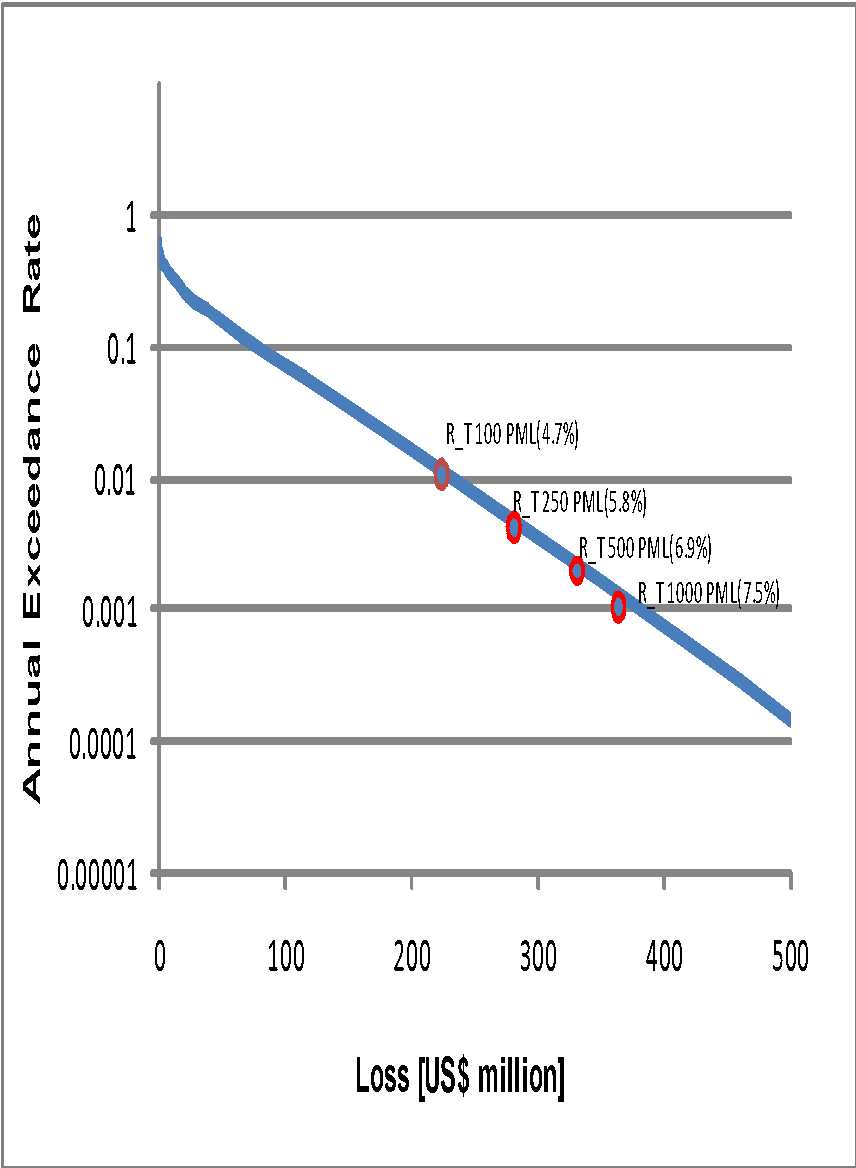
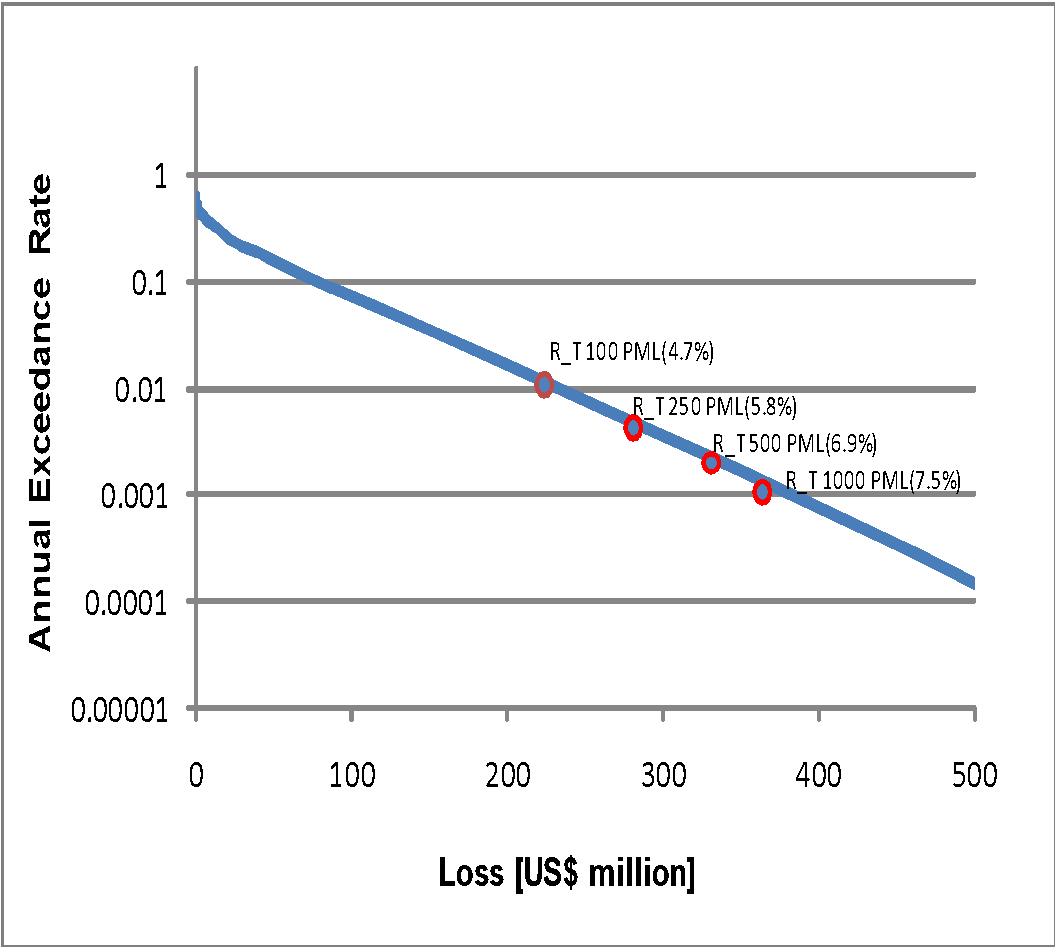
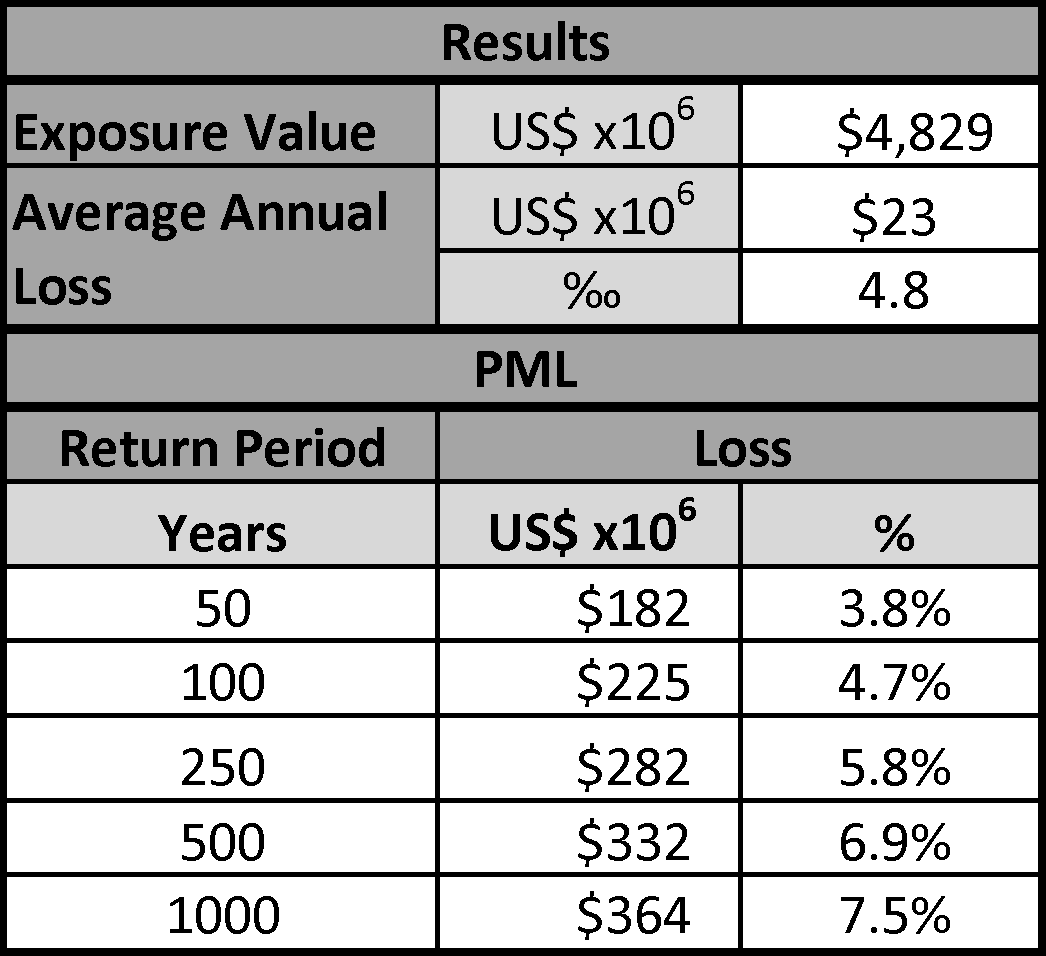
It shows the consolidated information nationwide, with the total exposure value, the average annual loss in value and in thousands (also known as technical risk premium) and the values that indicate probable maximum loss for different return periods.
Based on the probabilistic hazard models proposed and on the inventory and assessment of exposed assets, with their corresponding vulnerability functions, a probabilistic risk modeling was developed for hurricane winds in the country


The vulnerability functions for each one of these components are calculated using the module ERN-Vulnerabilidad (ERN 2010). The functions are generated in terms of maximum wind velocity. The curves are modified with factors that take into account particular aspects of the local constructive types such as material quality, general condition of constructions, design practices and characteristic construction, and in general the specific characteristics of the predominant structural types. It must be emphasized that several infrastructure components such as hydroelectric plants, pipe systems, road networks and others are in general lightly susceptible to the direct effect of the wind, reason why their vulnerability is assumed as null for the analysis.
- a. Calculation of the vulnerability functions of characteristic construction classes. For this, several analytical models have been developed and some previously published applicable functions have been used, in accordance with previous national or international experiences.
- b. Conformation of the database of constructions and main elements that represent the national inventory of assets.
- c. The analysis demands vulnerability functions for each of the types of elements that make up the national asset inventory.
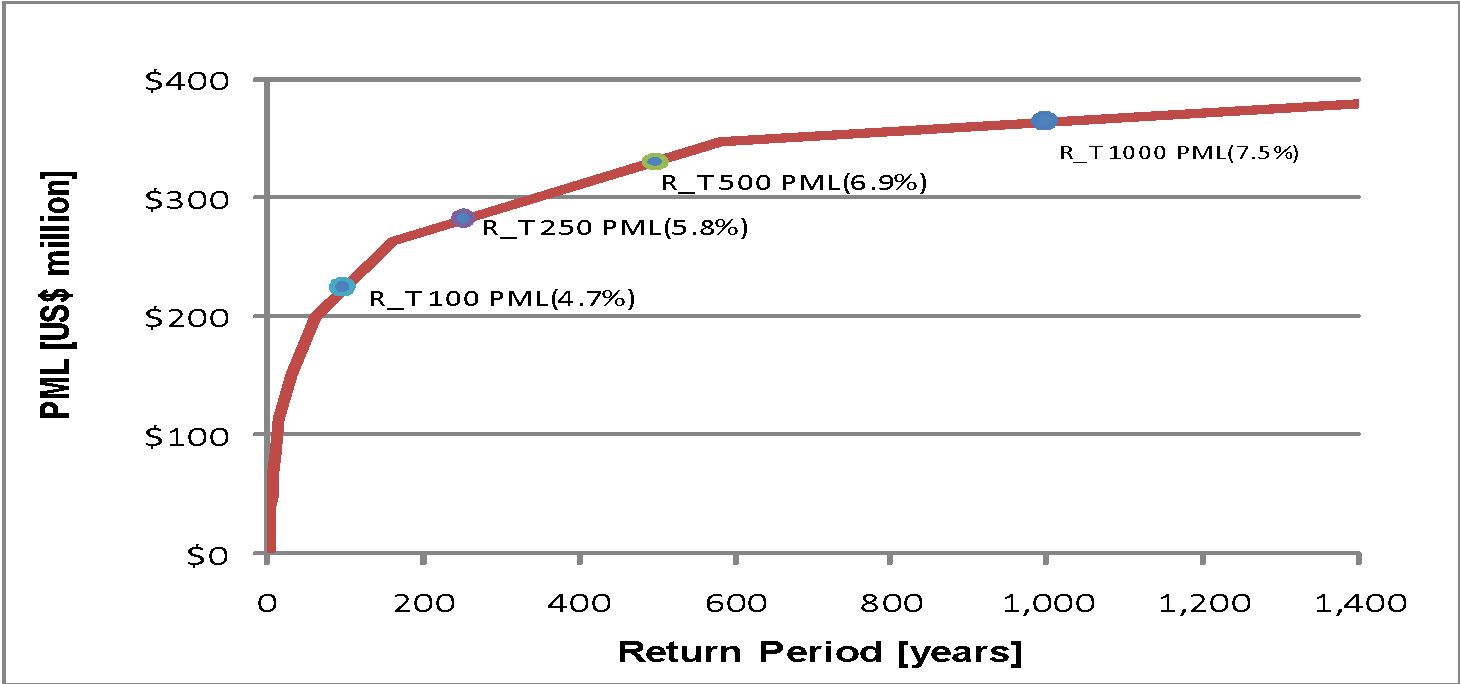
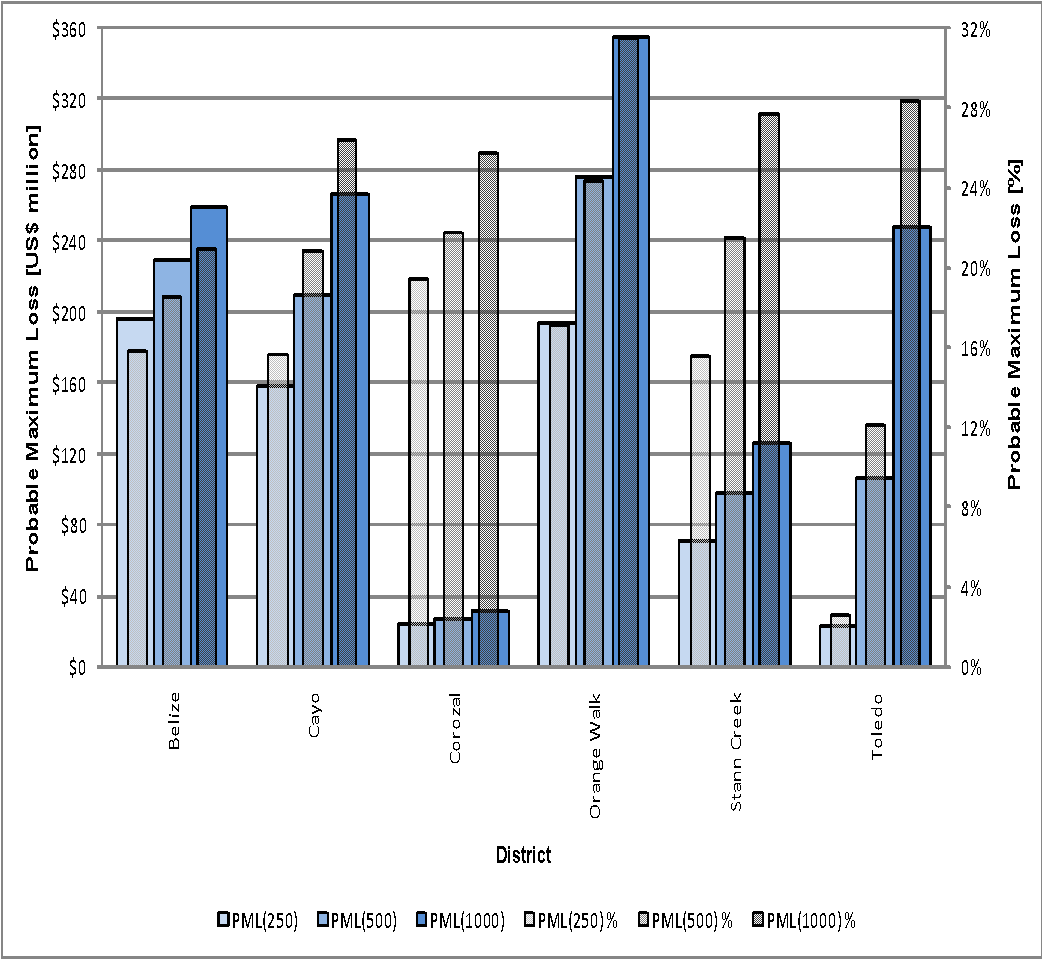
- a. It summarizes PML values for return periods of 250, 500 and 1000 years for each district in values as well as in percentage.
- b. Typification of the more representing and predominant constructions classes of the portfolio of exposed elements, based on existing information and the opinions and criteria obtained in the local level.
- c. Calculation of the vulnerability functions of characteristic construction classes.
- d. Database of constructions and main elements that represent the national inventory of assets.
- e. Assignment of a characteristic construction class and a function of
- a. Typification of the most representative and predominant classes of buildings in the portfolio of exhibited elements, based on existing information and opinions and criteria obtained at the local level.
- b. Assignment of a characteristic construction class and a vulnerability function associated with each item of the inventory of exposed assets.

The risk assessment must be prospective, scientifically anticipating possible events that may occur in the future. For the case of hurricanes, the hydro-meteorological information available of the historical hurricanes that have affected the area of study is used together with engineering methodologies; the effects of these phenomena upon the exposed assets are estimated. Due to the high uncertainties inherent to the models of analysis regarding the severity and frequency of occurrence of the events, the risk model is based on probabilistic formulations incorporating those uncertainties in the risk assessment.
- a. The risk of disaster or of extreme events requires the use of reliable methodologies that allow an adequate estimation and quantification of potential losses in a given exposure time.
- b. A complementary individual analysis is conducted for the national infrastructure sector: Energy generation and distribution, Communications, Hydrocarbons
- c. There have been developed, internationally diverse methodologies for detailed risk assessment for different types of natural hazards, few methods allow analysis at country level for two main reasons: first, the lack of detailed information that prevents the formation of a robust database to describe the exposure and, secondly, the lack of methodologies for an integrated modeling of the hazards, the vulnerability of the exposed elements and the risk from their convolution.


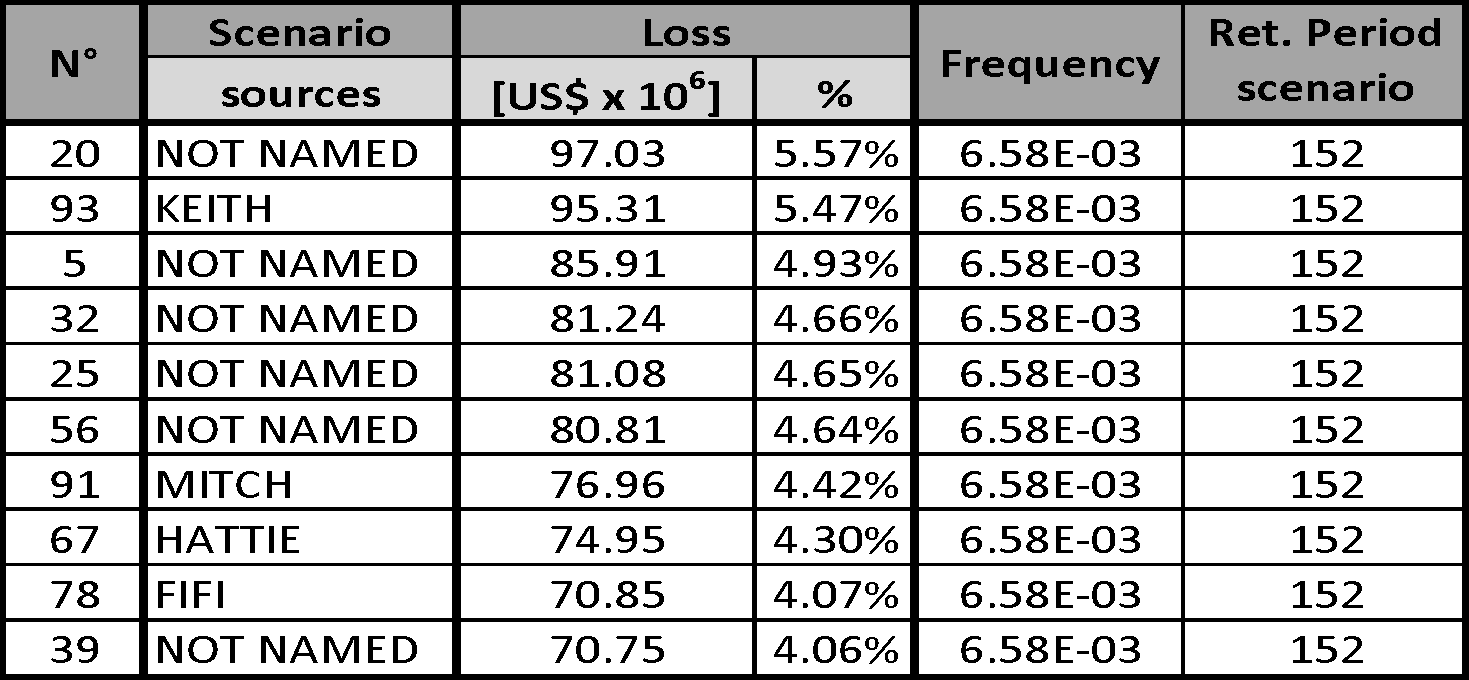
- a. Summary table for a comparative risk analysis between earthquakes and hurricanes (wind).
- b. Summarizes PML values for return periods of 250, 500 and 1000 years for each district in values as well as in percentage.


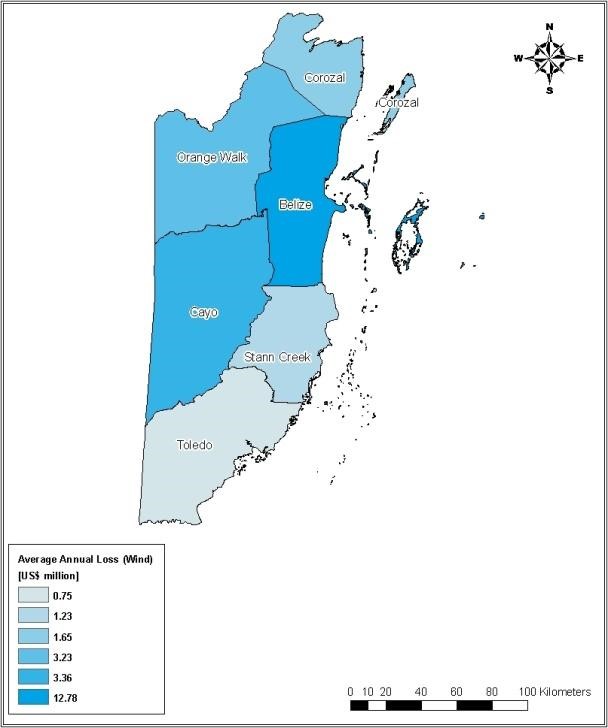
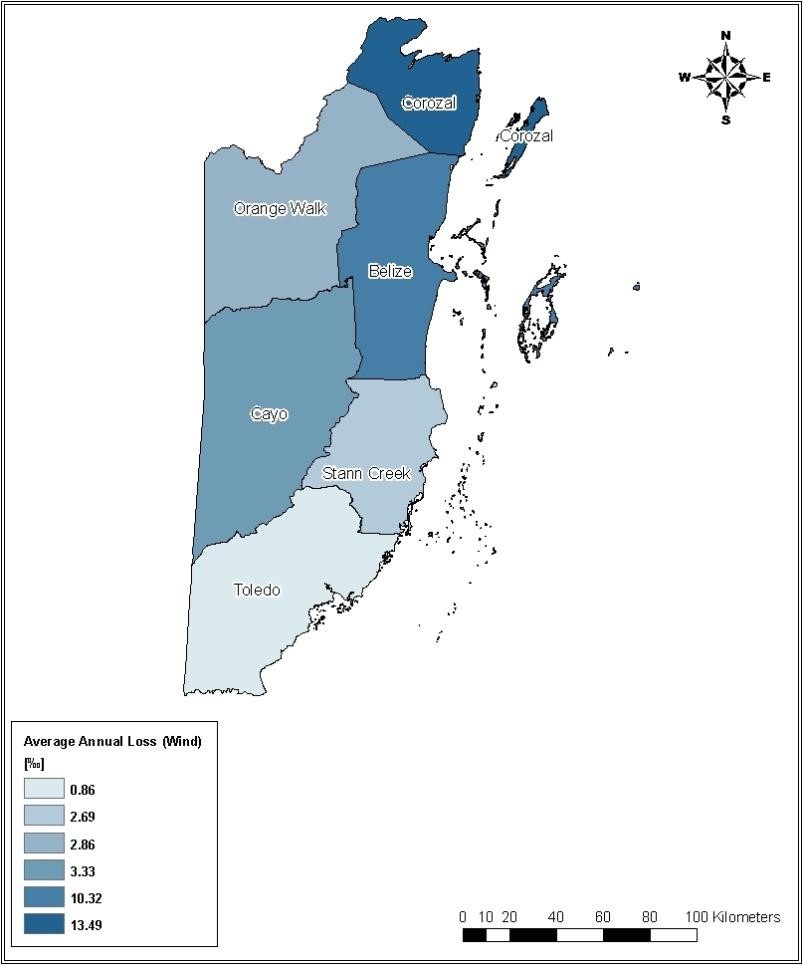
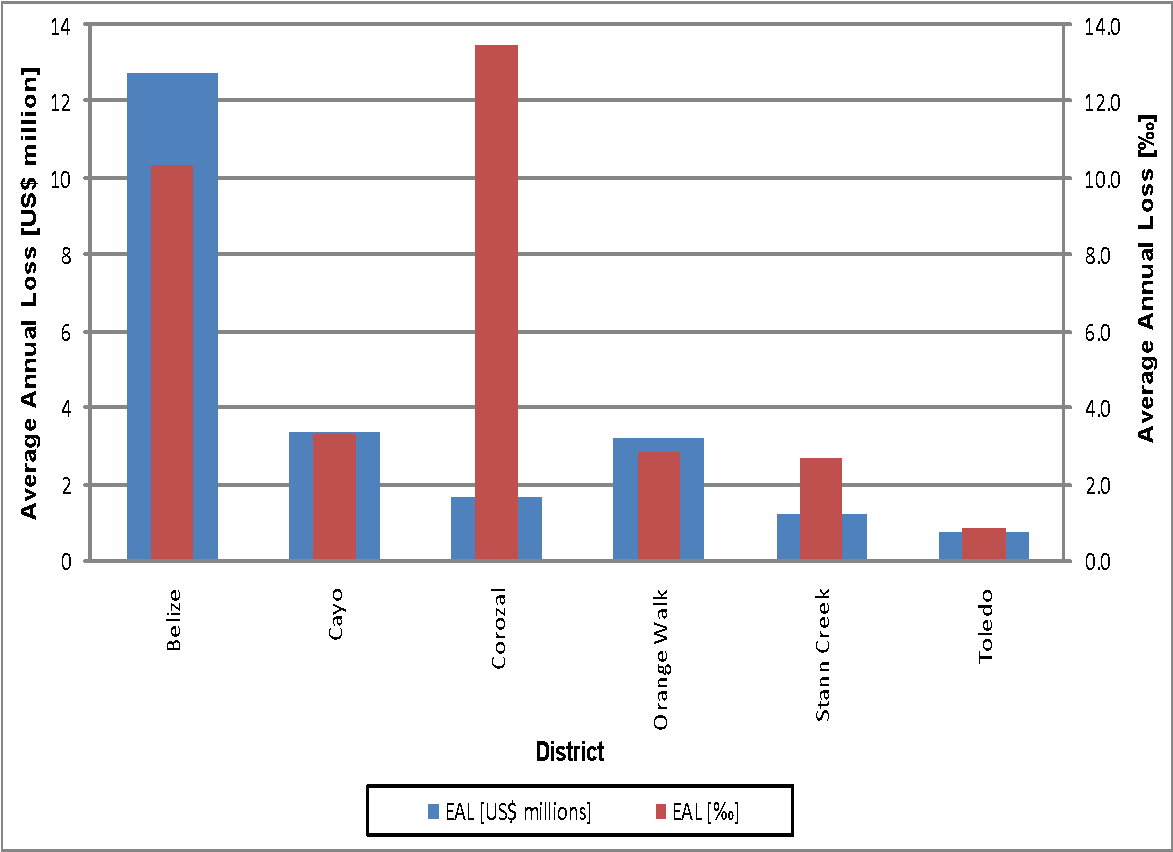
- a. The analysis of risk concentration is carried out at district level, for the different sectors of use for the public and private sectors.
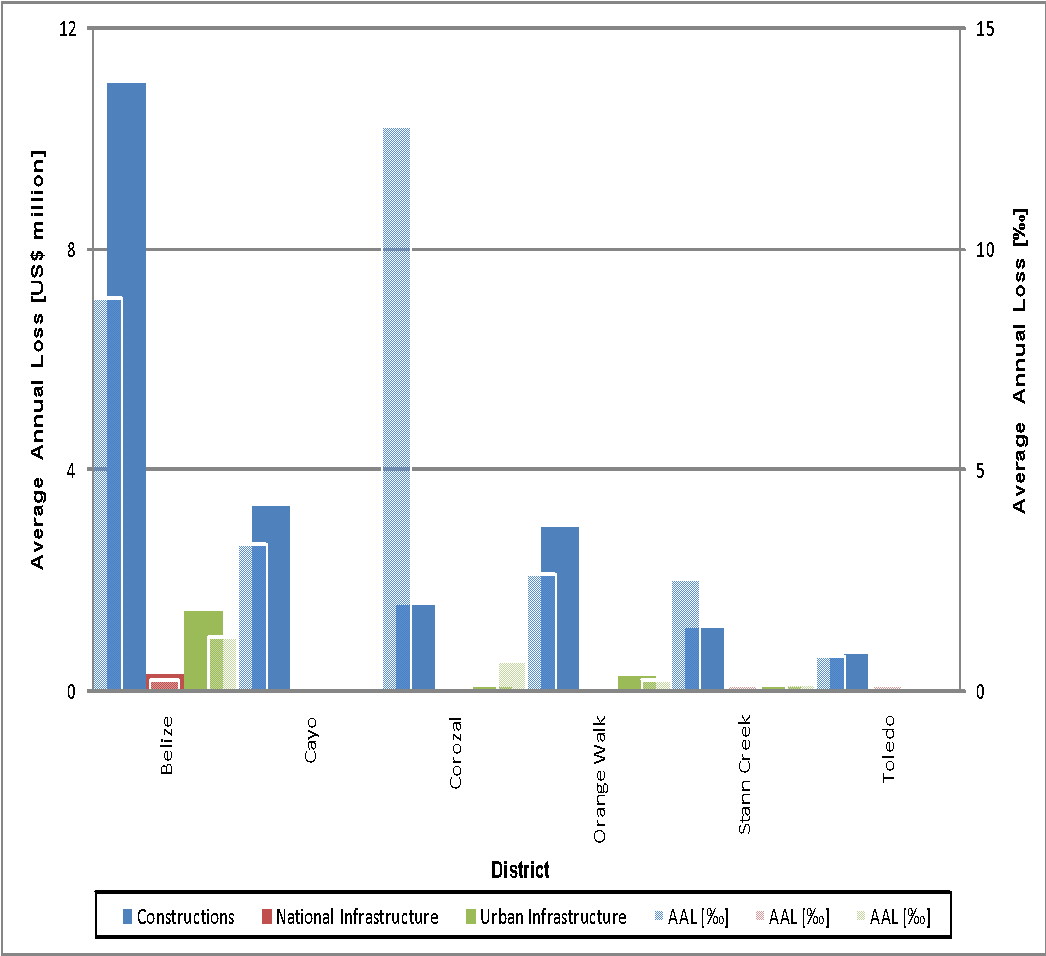
- b. A complementary individual analysis is conducted, that allows estimating the probable maximum loss and the individual premium level by district table of the average annual loss Curves of loss exceedance rates Bar diagrams showing the AAL in exposed values and thousands of exposed values, for each sector of use.